How Healthy is Your Water?
41.667591, -70.917764 41.7636721, -70.68837642 41.516959, -71.012313 41.588399, -70.954223 41.67344756, -70.75529911 41.628333, -70.817572 41.477863, -71.165699 41.746983, -70.628717 41.7586829, -70.62081064 41.58745, -70.74656 41.603127, -70.922086 41.419648, -70.934227 41.644921, -70.636588 41.561313, -70.653198 41.565942, -70.648703 41.511442, -70.703441 41.624335, -70.638429 41.437380, -70.672192 41.459923, -70.624782 41.707719, -70.619716 41.730836, -70.679056 41.54124, -70.971239 41.576068, -70.63671 41.649802, -70.810449 41.655869, -70.633846 41.337633, -70.773361 41.616093, -70.837338 41.624136, -70.908585 41.551127, -70.939402 41.735393, -70.649262 41.4485221, -70.9208785 41.7243382, -70.61981158 41.686678, -70.634901 41.695633, -70.619585 41.649439, -70.761665 41.506968, -71.130745 41.540423, -70.658604 41.649799, -70.629619 41.674489, -70.621399 41.505289, -71.113364 41.54299339, -70.93172872 41.530765, -70.953811 41.695447, -70.748141 41.74394, -70.804371 41.545144, -71.000118 41.661647, -70.621257 41.744823, -70.617932 41.495578, -71.138437 41.735104, -70.628775 41.447978, -70.730385 41.770097, -70.72237 41.74459647, -70.70687286 41.604039, -70.64275 41.517189, -71.068703 41.737699, -70.746408 41.63777, -70.647367 41.700639, -70.721693

What is the Bay Health Index?

The Bay Health Index measures the nutrient-related health of more than 100 harbors, coves, salt ponds and rivers throughout Buzzards Bay and Vineyard Sound. The index is a snapshot of the Bay’s health, using monitoring data collected each summer by the Coalition’s Baywatchers program and analyzed the Marine Biological Laboratory in Woods Hole. Each local waterway is assigned a score between 100 and 0, with 100 being pristine water and 0 representing severe nitrogen pollution. For nearly 30 years, this data has formed the foundation of work to protect clean water in our region.

What does my Bay Health score mean?

0-35

Poor

There is too much nitrogen pollution in the water. Underwater habitats are unhealthy for fish and shellfish. The waterway is not functioning as a viable ecosystem.

Some signs include:
  • Murky water with visibility of less than 2 feet.
  • No eelgrass beds. Instead, the bottom may be smothered with thick, dense mats of algae.
  • Few fish and shellfish species are present. Only the most resilient species can live here.
  • Dissolved oxygen levels are regularly too low for many underwater species to survive.
  • In extremely poor waterways, the water may smell like rotten eggs and the bottom sediments may be mucky.
35-65

Fair

These are transitional areas that are either improving or, more likely, becoming more polluted with nitrogen. The habitat health is damaged.

Some signs include:
  • Cloudy water has caused eelgrass beds to become sparse or completely disappear, especially in the inner portion of the waterway.
  • The amount and diversity of underwater life have declined.
  • Underwater habitats are not healthy. Mats of algae may cover parts of the bottom.
  • From time to time, dissolved oxygen levels drop and algal blooms grow, turning the water green or brown. This causes stress to fish and shellfish.
65-100

Good

There is little nitrogen pollution in the water. The waterway offers healthy underwater habitats for fish and shellfish. Overall, the ecosystem is in balance.

Some signs include:
  • Clear blue water with visibility greater than 6 feet deep. Sunlight can penetrate through the water to reach eelgrass at the bottom.
  • Lush eelgrass beds that are home to a diverse array of underwater life.
  • High dissolved oxygen levels that allow fish and shellfish to thrive. Even sensitive species like bay scallops can live here.
  • Algal blooms occur infrequently.

What does the Bay Health Index measure?

The Buzzards Bay Coalition scores the health of local waterways  between 0 and 100. A Bay Health score of 100 represents pristine water and 0 represents water severely polluted with nitrogen. (The score does not measure bacteria, and does not indicate swimmability or shellfish bed status.)

The Bay Health Index is the sum of five health indicators: nitrogen (organic and inorganic), dissolved oxygenalgal pigments, and water clarity. Data are combined and reported as a single score that provides a snapshot of a waterway’s health. (Note: The Bay Health Index does not include bacteria and is not an index of swimmability or shellfish bed status.)

Nitrogen

thick green algae on the surface of West Falmouth Harbor

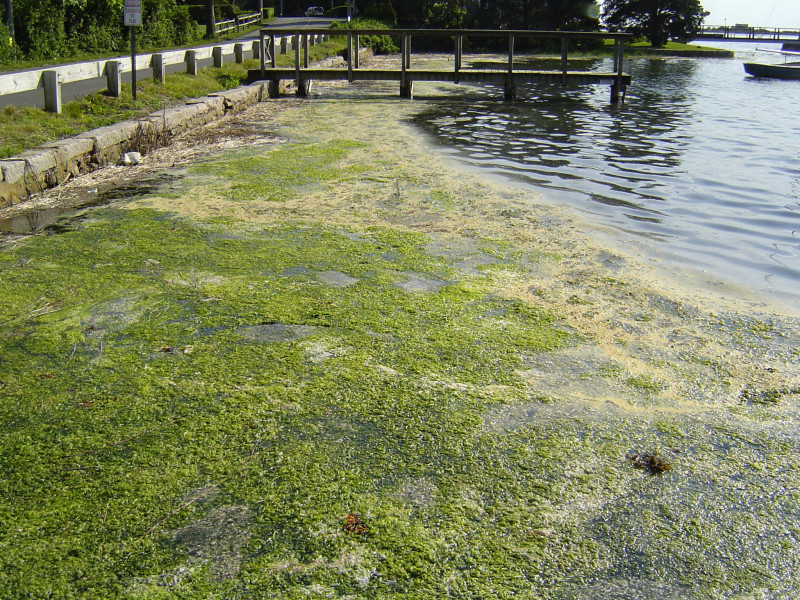
Nitrogen pollution fuels the growth of algae, like this algae bloom in West Falmouth Harbor.

Nitrogen is a type of nutrient that controls plant production in Buzzards Bay. Some nitrogen is an essential part of any waterway. But when there’s too much nitrogen in the water, it can become pollution.

The Coalition monitors two forms of nitrogen in Buzzards Bay: inorganic and organic. Tracking both forms of nitrogen helps to identify their source and potential impact on our water. Our nitrogen monitoring is conducted with the Marine Biological Laboratory in Woods Hole.

Dissolved Oxygen

Dissolved oxygen is the amount of oxygen in the water. Just like you and me, fish, shellfish, and plants all need oxygen to survive.

Dissolved oxygen is an important factor for determining a waterway’s health. When oxygen levels are low, it’s an indication that there is too much nitrogen pollution in the water.

Algal Pigments

Chlorophyll a is a green plant pigment found in algae and most phytoplankton. Plants use chlorophyll a during photosynthesis.

Measuring chlorophyll a and its immediate breakdown product, pheophytin a, indicates the amount of algae in the water. High chlorophyll levels are often a sign of nitrogen pollution.

Water Clarity

a woman holding a Secchi disc by the water in Dartmouth

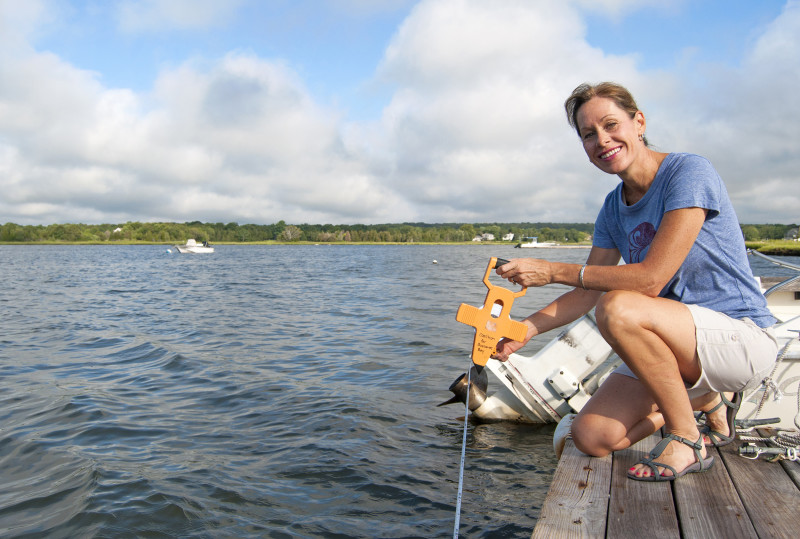
Volunteer Baywatchers use a Secchi disk attached to a measuring tape to record water clarity.

Water clarity is affected by the amount of algae and sediment particles suspended in the water. Good water clarity is vital to the health of a waterway. When the water is too cloudy, sunlight can’t reach eelgrass growing at the bottom.

Water clarity is measured using a Secchi disk: a black-and-white circle attached to a measuring tape. The disk is lowered into the water until it’s no longer visible. This depth is known as the “Secchi depth.”

Bay Health data is funded in part by the Massachusetts Environmental Trust.
secondary sponsor logo

Volunteer

Become a Baywatcher

Help the Buzzards Bay Coalition keep an eye on the health of the water in your community. Become a Baywatcher, and you can volunteer as a "citizen scientist" on the water this summer.

Read More ›

Working to Save Buzzards Bay

The Buzzards Bay Coalition is a membership-supported organization dedicated to improving the health of the Buzzards Bay ecosystem for all through education, conservation, research, and advocacy.

We work to protect clean water on the Bay and on the land: